Node Debugging Jest Test
How to profile Jest tests with Node DevTools to find performance issues and reduce test times by 90%
Fixing Jest Performance Issues
We had an integration test that was repeatedly timing out. Without investigating, we just kept bumping the timeout for the test suite—until it got both too ridiculous and too lazy to keep doing. Eventually, individual test suites were taking longer than 20 seconds to run.
TL;DR
🔍 Root Causes:
- The
amazon-cognito-identity-jslibrary, used to resolve access tokens, was eating 29% of execution time. - The TypeScript compiler was hogging an equal share of execution time.
⚡ Solutions:
- Replaced
amazon-cognito-identity-jsby loading authentication credentials as environment variables. - Configured the TypeScript compiler to skip type checking and focus solely on transpilation to JavaScript.
🎉 Results:
- 90% reduction in test time.
The Problem
I had an integration test that was taking, on occasion, longer than 20s to run. That’s not just slow, it was breaking our CI pipeline and developer workflow.
FAIL __integrationTests__/api/get-summary.test.ts (15.599 s) Account Summary API ✕ returns the correct account information (5004 ms)The test itself was straightforward:
import frisby from "frisby";
import { getToken } from "../../getToken";
describe("Account Summary API", () => { it("returns the correct account information", async () => { const expectedAccountSummary = { accountId: "abc123", accountName: "Demo Account", };
const authToken = await getToken();
const response = await frisby .get("https://api.example.com/accounts/abc123/summary", { headers: { Authorization: `Bearer ${authToken}`, }, }) .promise();
expect(response.status).toBe(200); expect(response.json).toEqual(expectedAccountSummary); });});Diagnosing The Problem
In order to get an accurate picture of what was causing the test to timeout I made use of the Node debugger and profiler.
Collecting The Data
I got the original influence from Profiling a jest test with the Chrome DevTools performance profiler.
node --cpu-prof --inspect ./node_modules/jest-cli/bin/jest.js --runInBandWhich I passed the path to my relevant Jest configuration and the specific test I wanted to run:
node --cpu-prof --inspect ./node_modules/jest-cli/bin/jest.js --config=jest.integration.config.js --runInBand __integrationTests__/api/get-summary.test.tsAnd, finally, I ran it with my AWS credentials loaded via AWS Vault:
aws-vault exec conqa -- node --cpu-prof --inspect ./node_modules/jest-cli/bin/jest.js --config=jest.integration.config.js --runInBand __integrationTests__/api/get-summary.test.tsBut, how do I collect a profile?
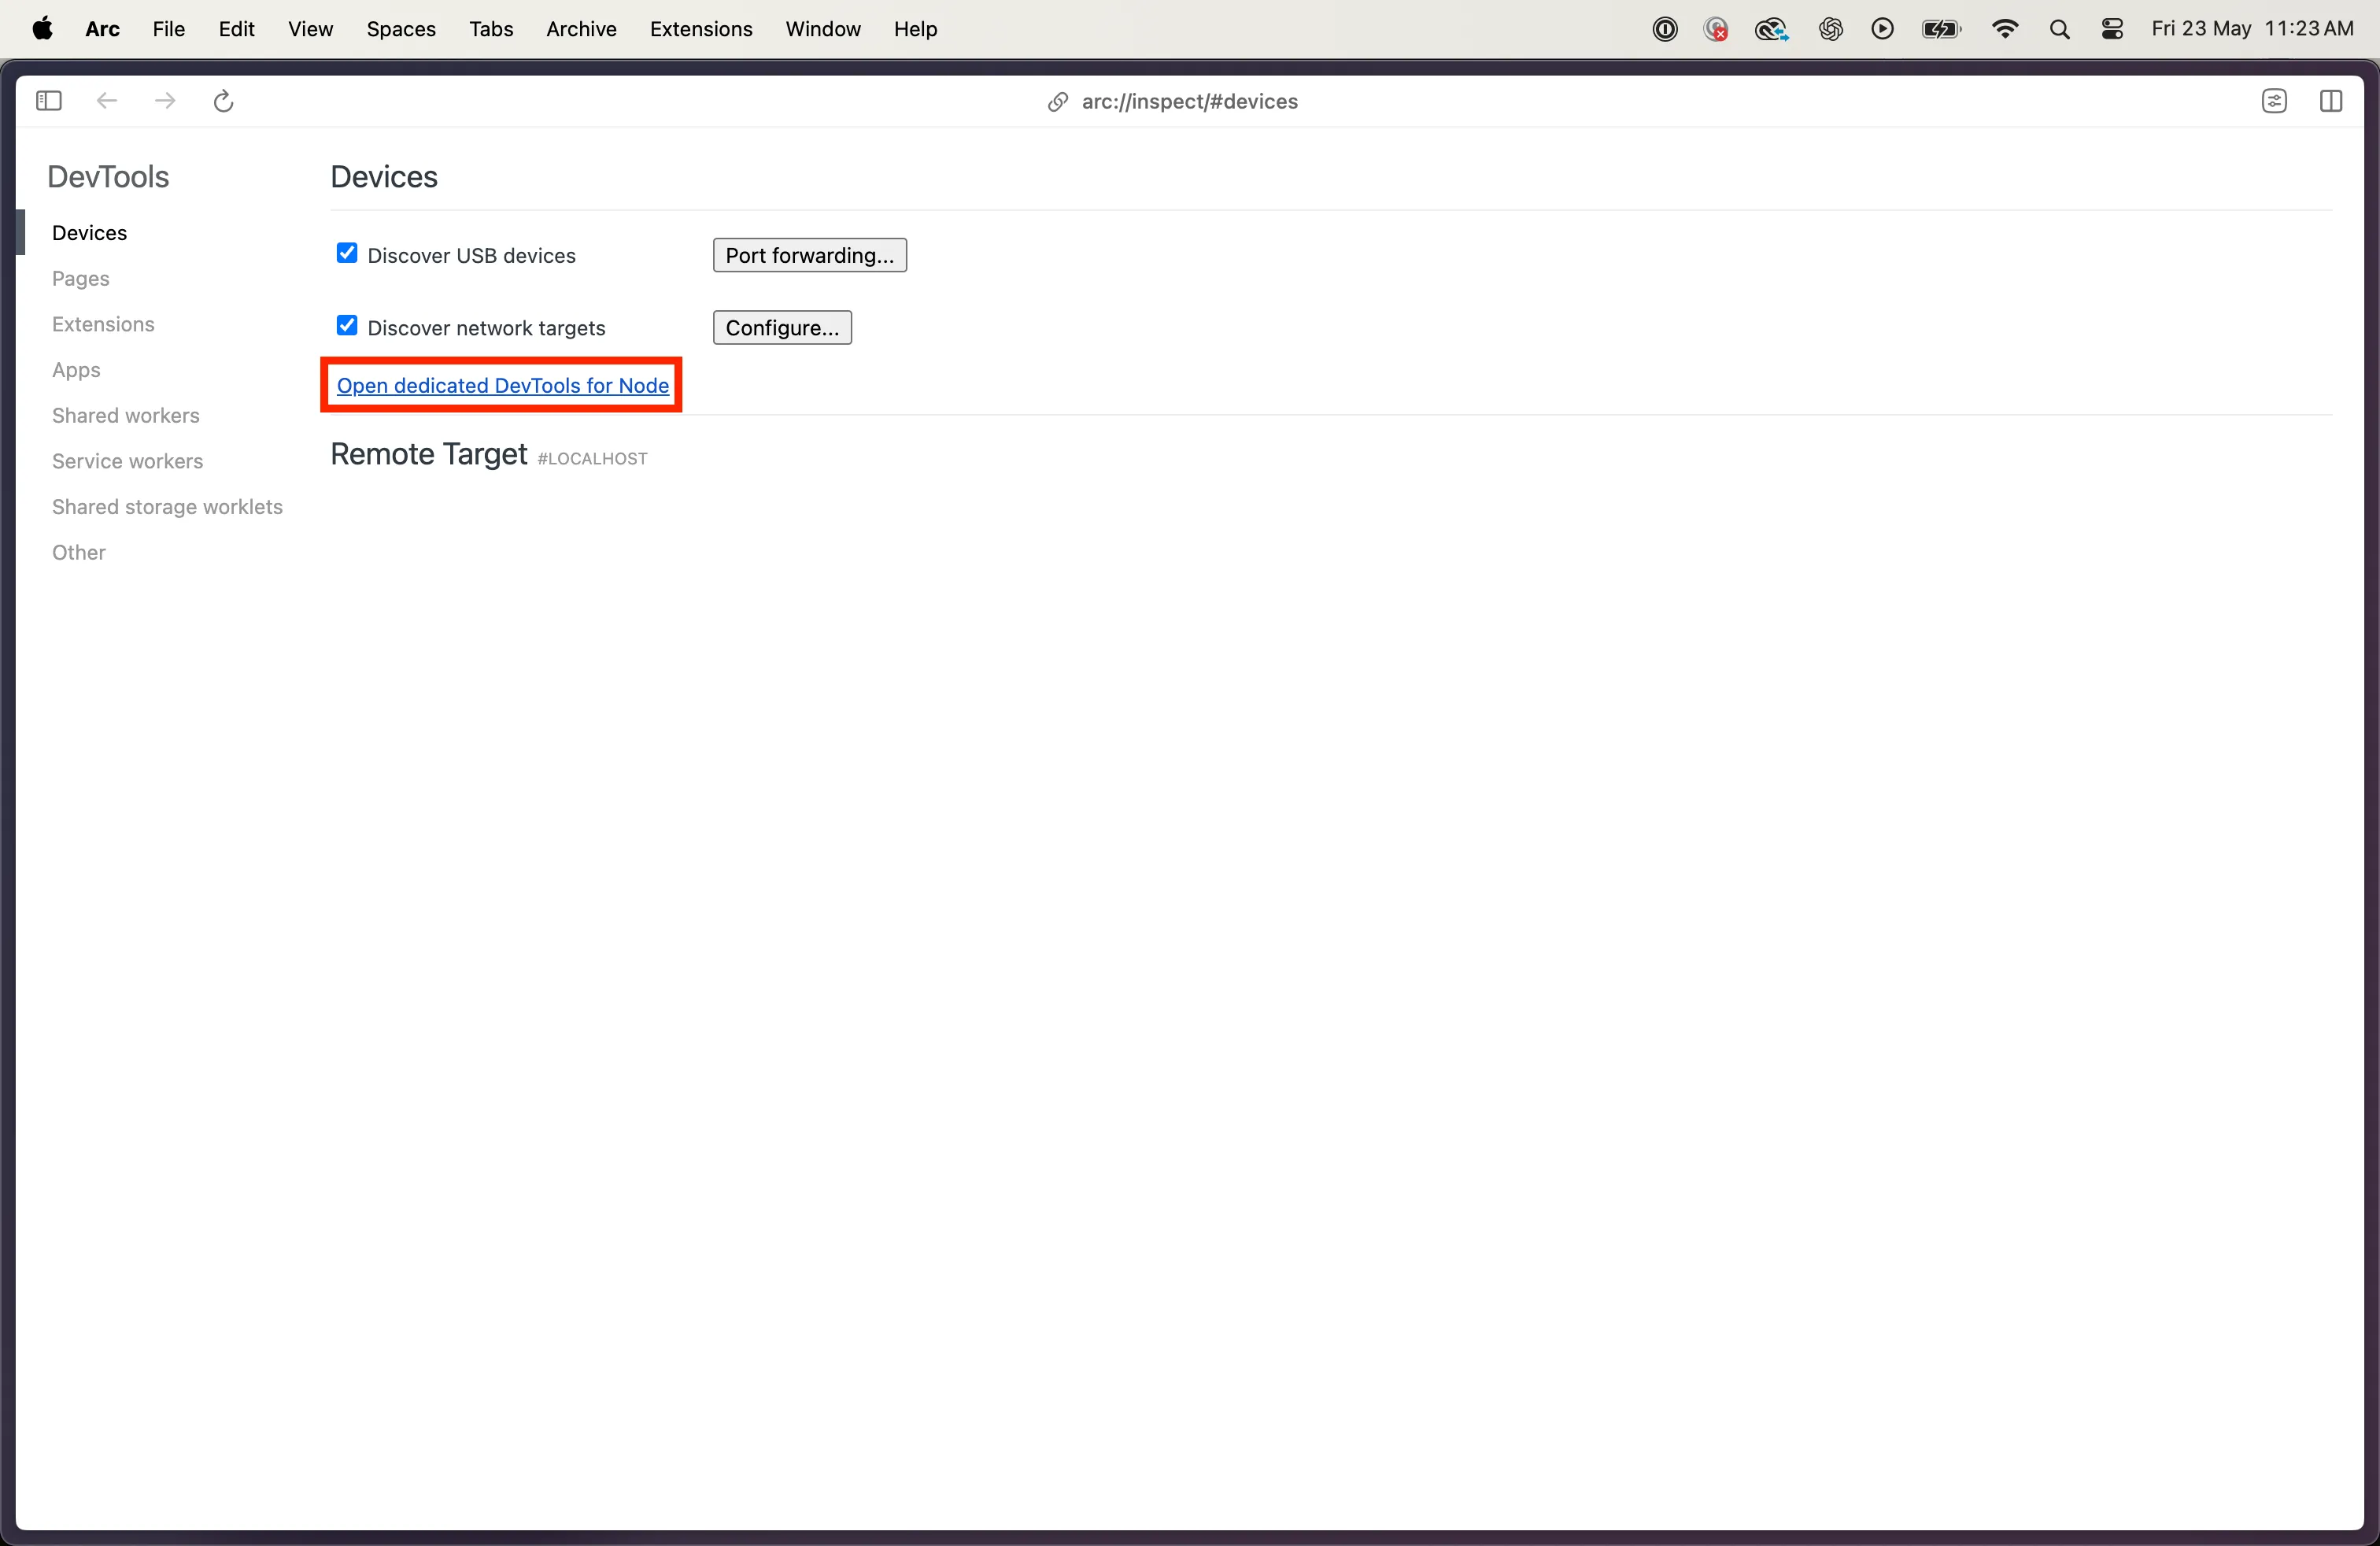
1. Open the Dedicated Node DevTools
Visit chrome://inspect in your browser and open the dedicated DevTools for Node.
2. Run The Node Profile Script
Run the script and pause the debugger immediately after it starts executing.
Alternatively, if you run the tests in watch mode, you can skip pausing the debugger. Just start the profiler as shown below, then save your test file to trigger a re-run — the profiler will capture a profile from the test run. It’s worth noting that when profiling a test in watch mode, the profiler will also capture a lot of idle time that Jest spends waiting, which can clutter the results.
3. Start The Profiler in Node DevTools
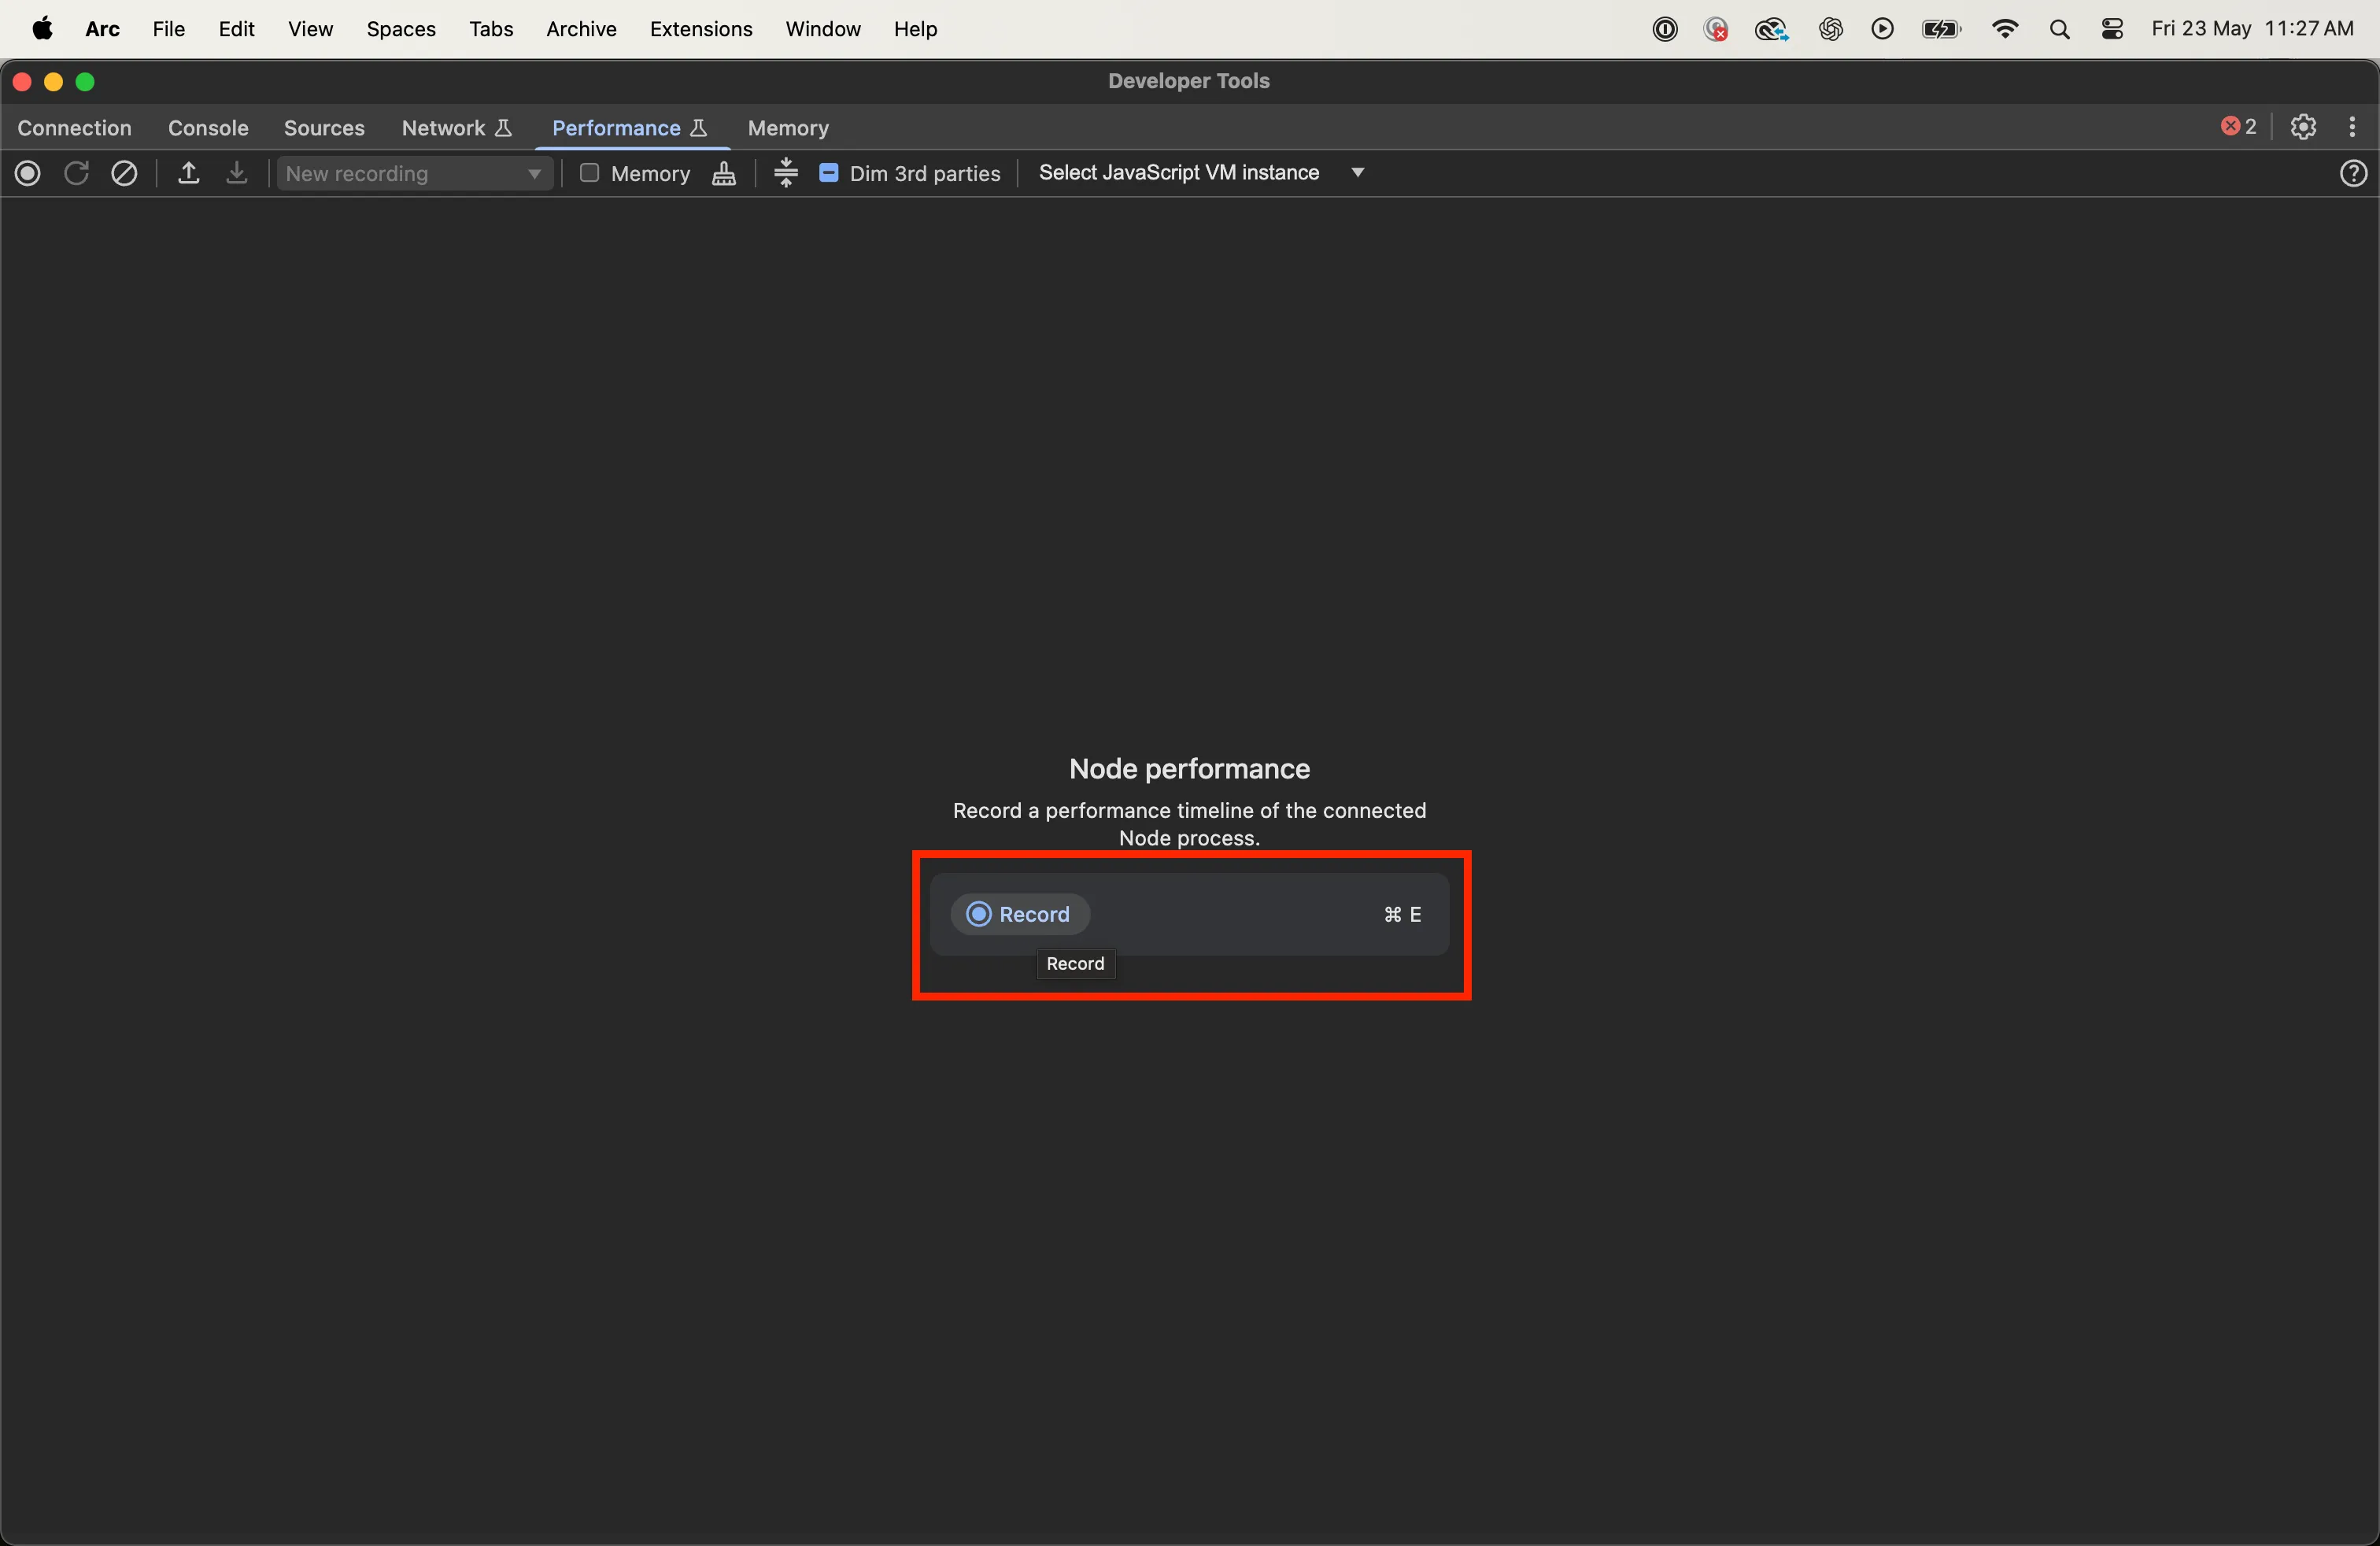
Start the script, then switch to your IDE where the debugger is paused and click play. After it finishes running, go back to DevTools and stop the recording — you’ll now have your profile.
Analysing The Data
amazon-cognito-identity-js
From the flame graph below, we can see that the test function ran twice. I am not sure why this is the case. Importantly, is that the time the test took to execute was minimal 44ms of the total ~28s execution time.
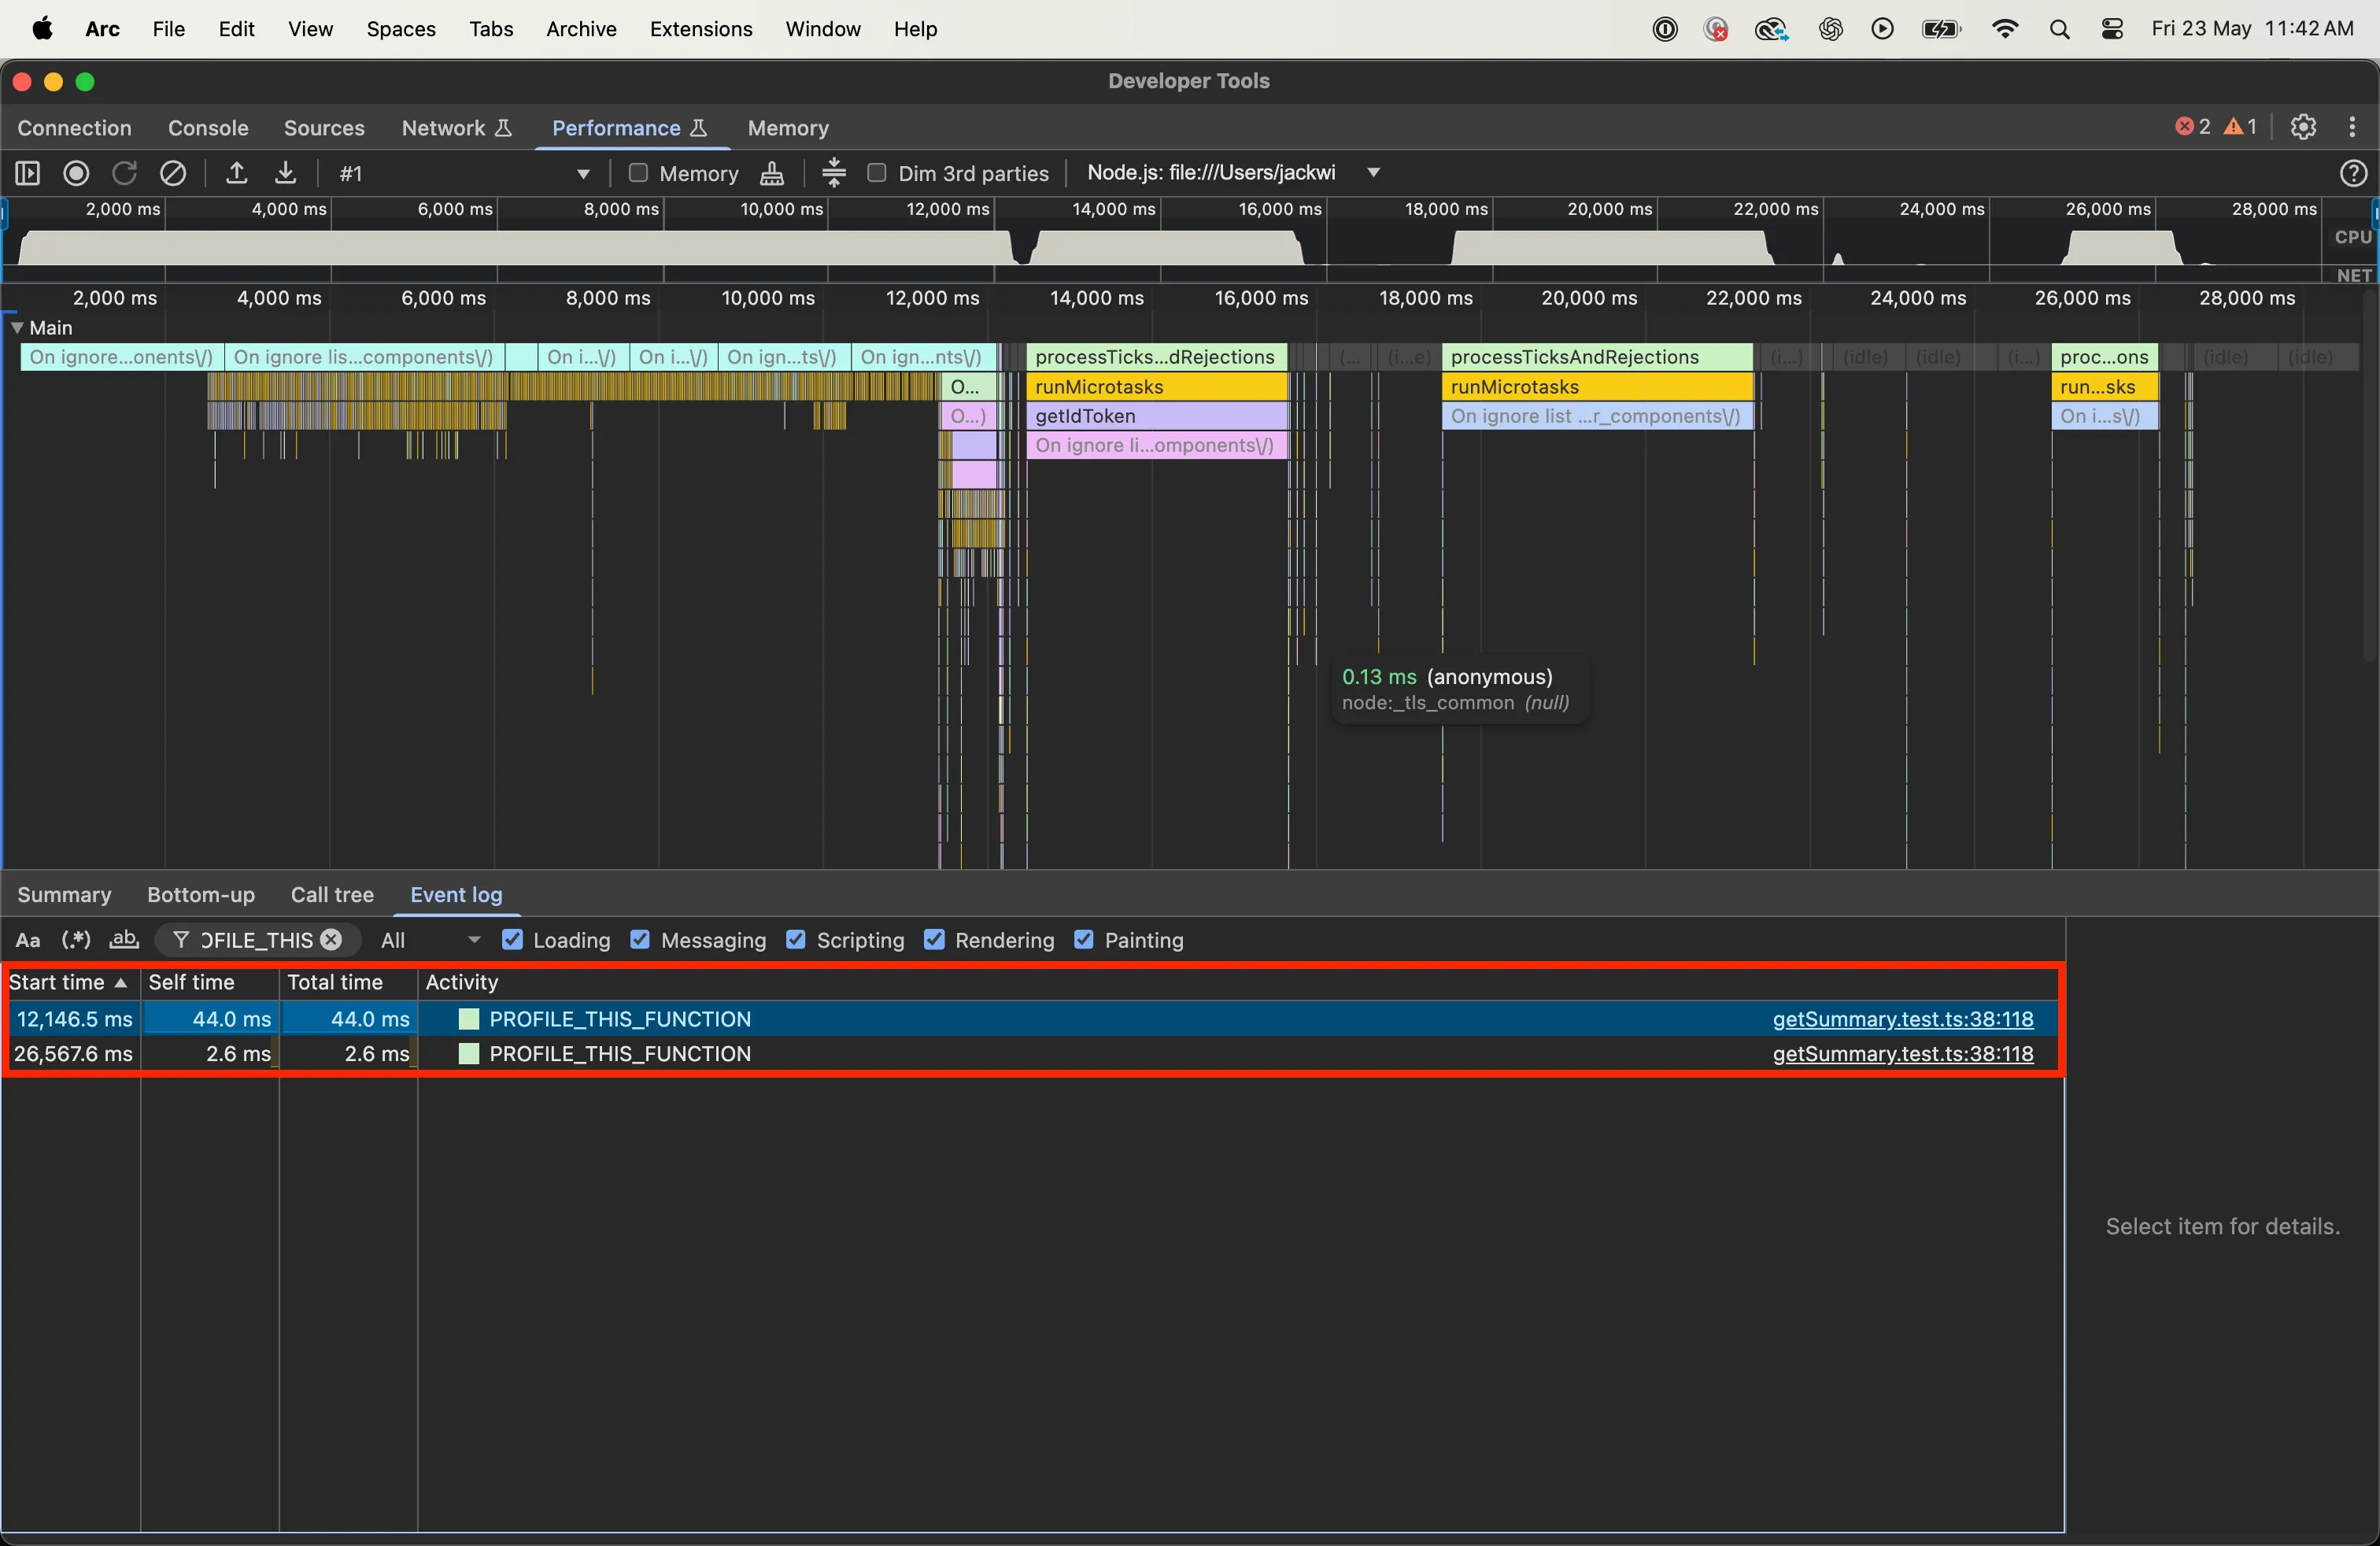
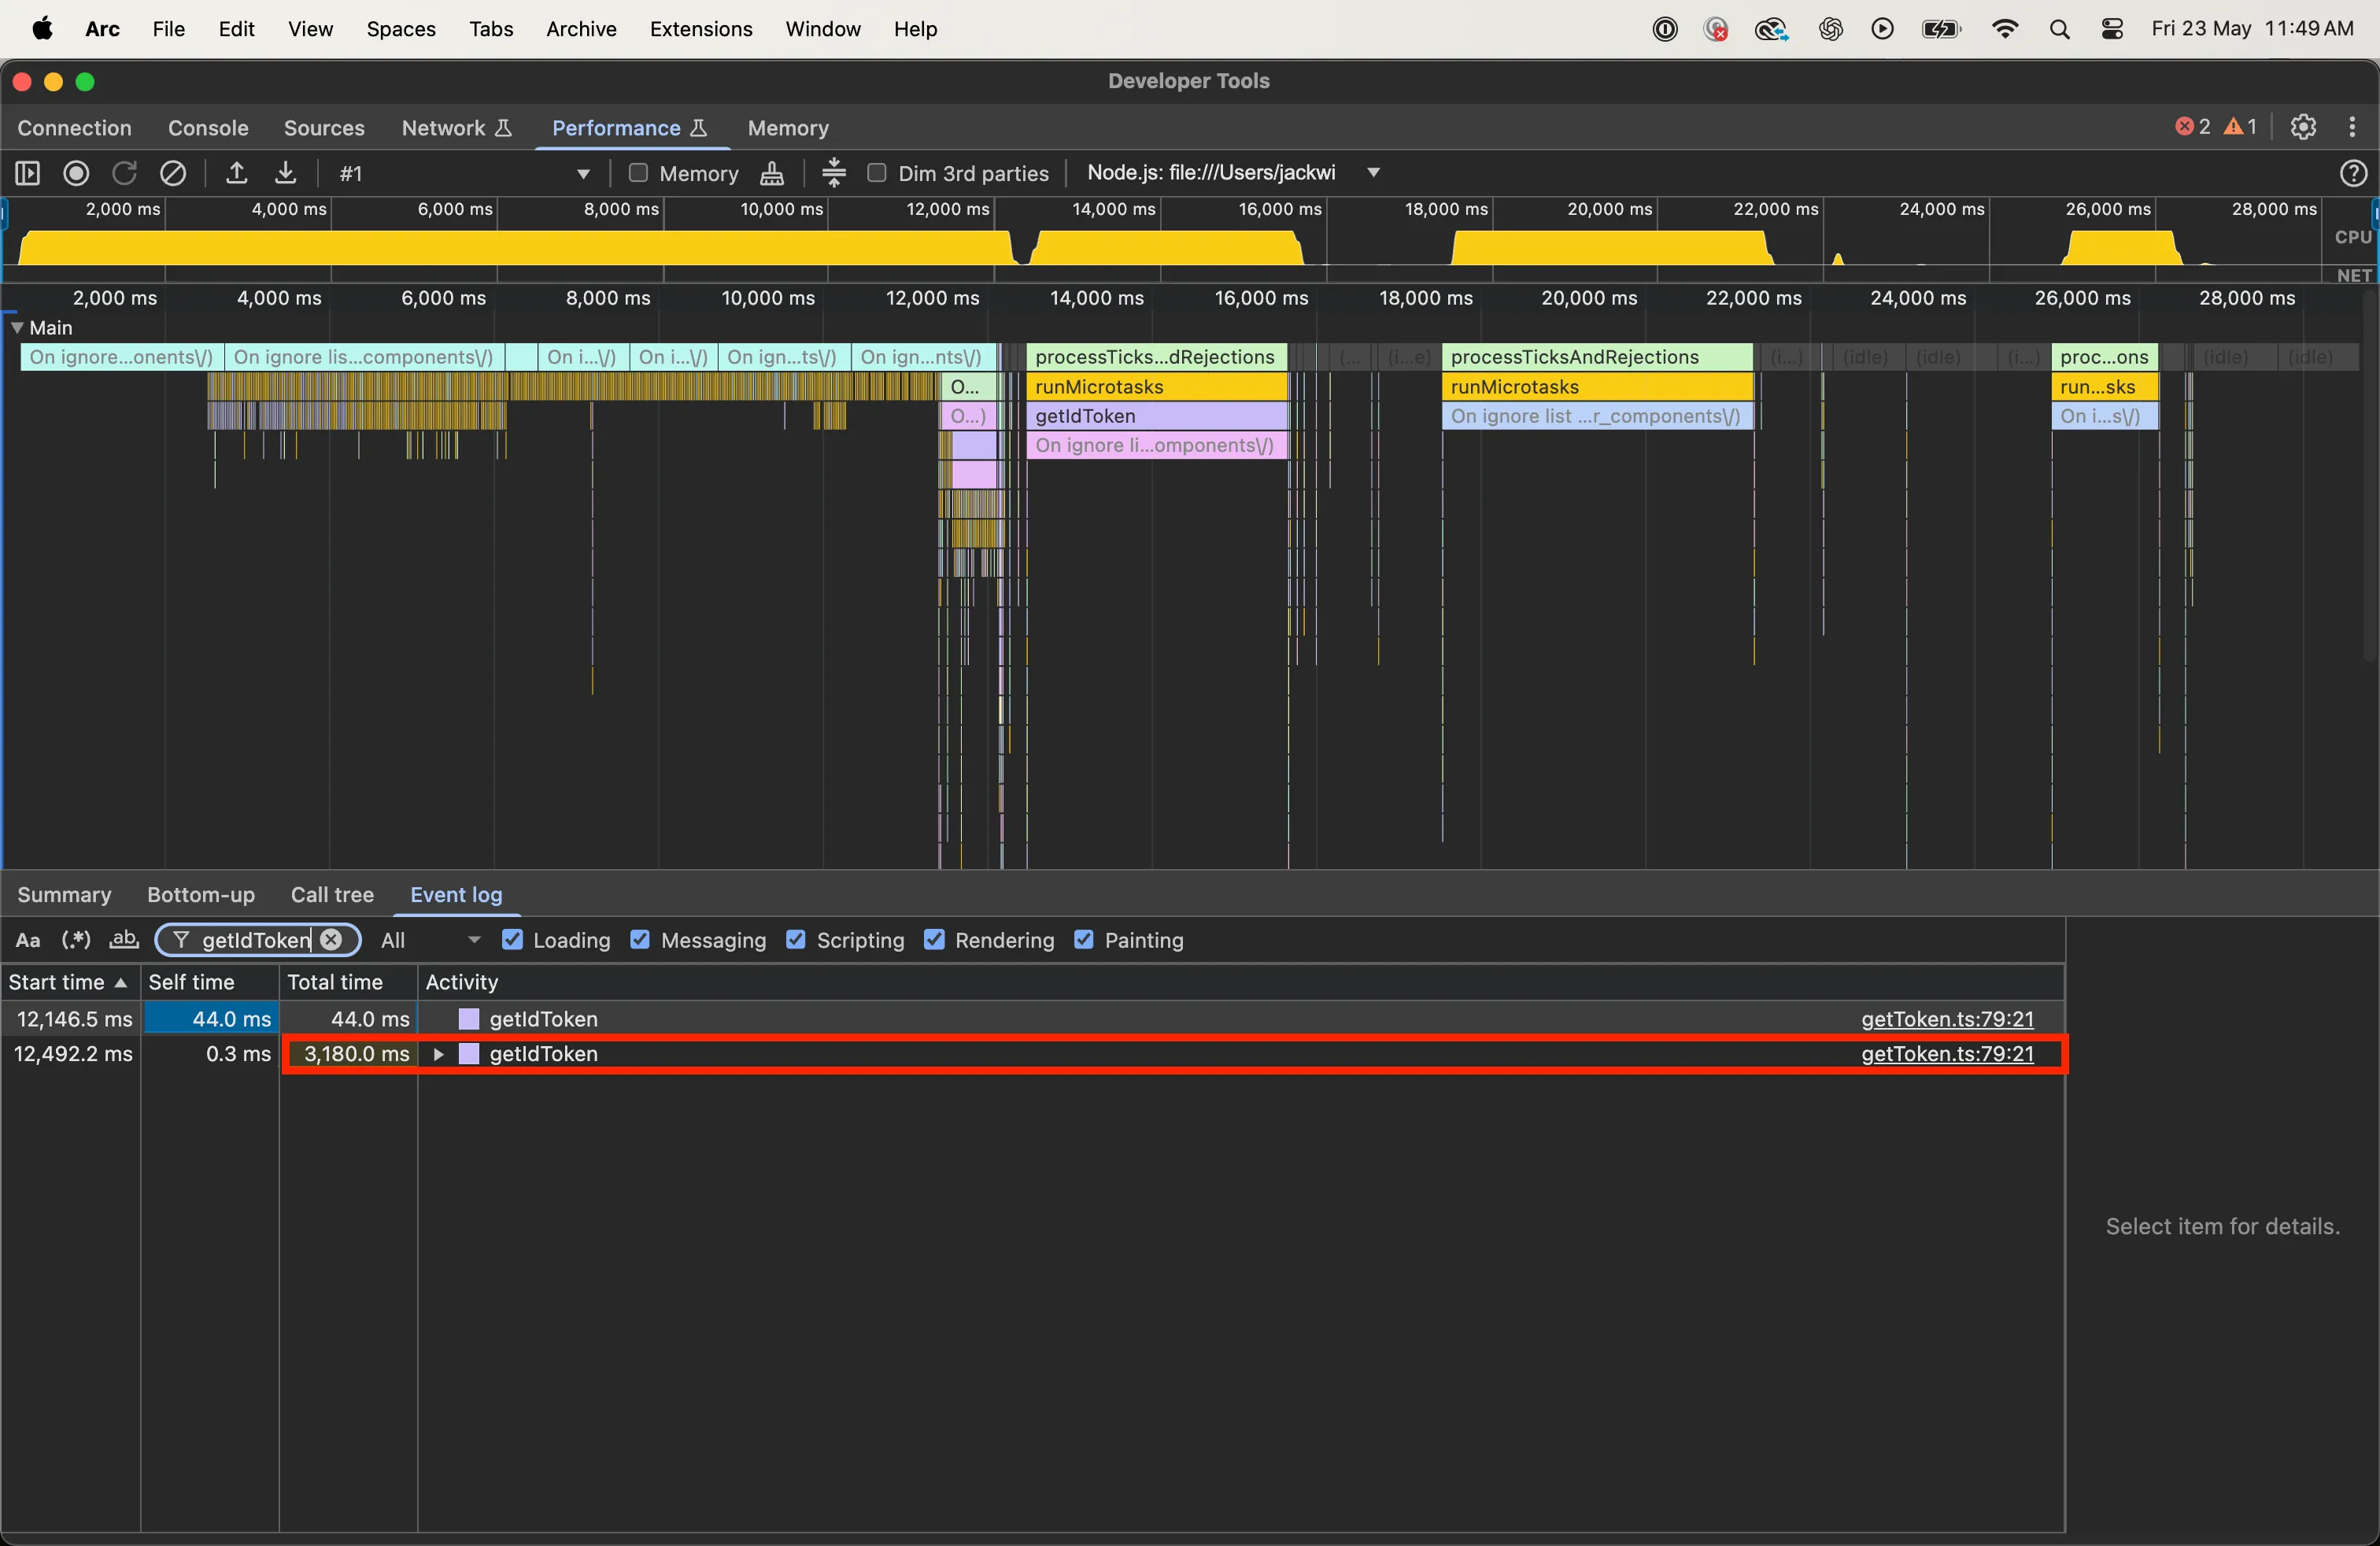
If we drill into the first invocation of the test function, we can see a getToken (getIdToken) call. However, like its parent function, it only took 44ms to resolve. So how could this token resolution be causing the test to timeout?
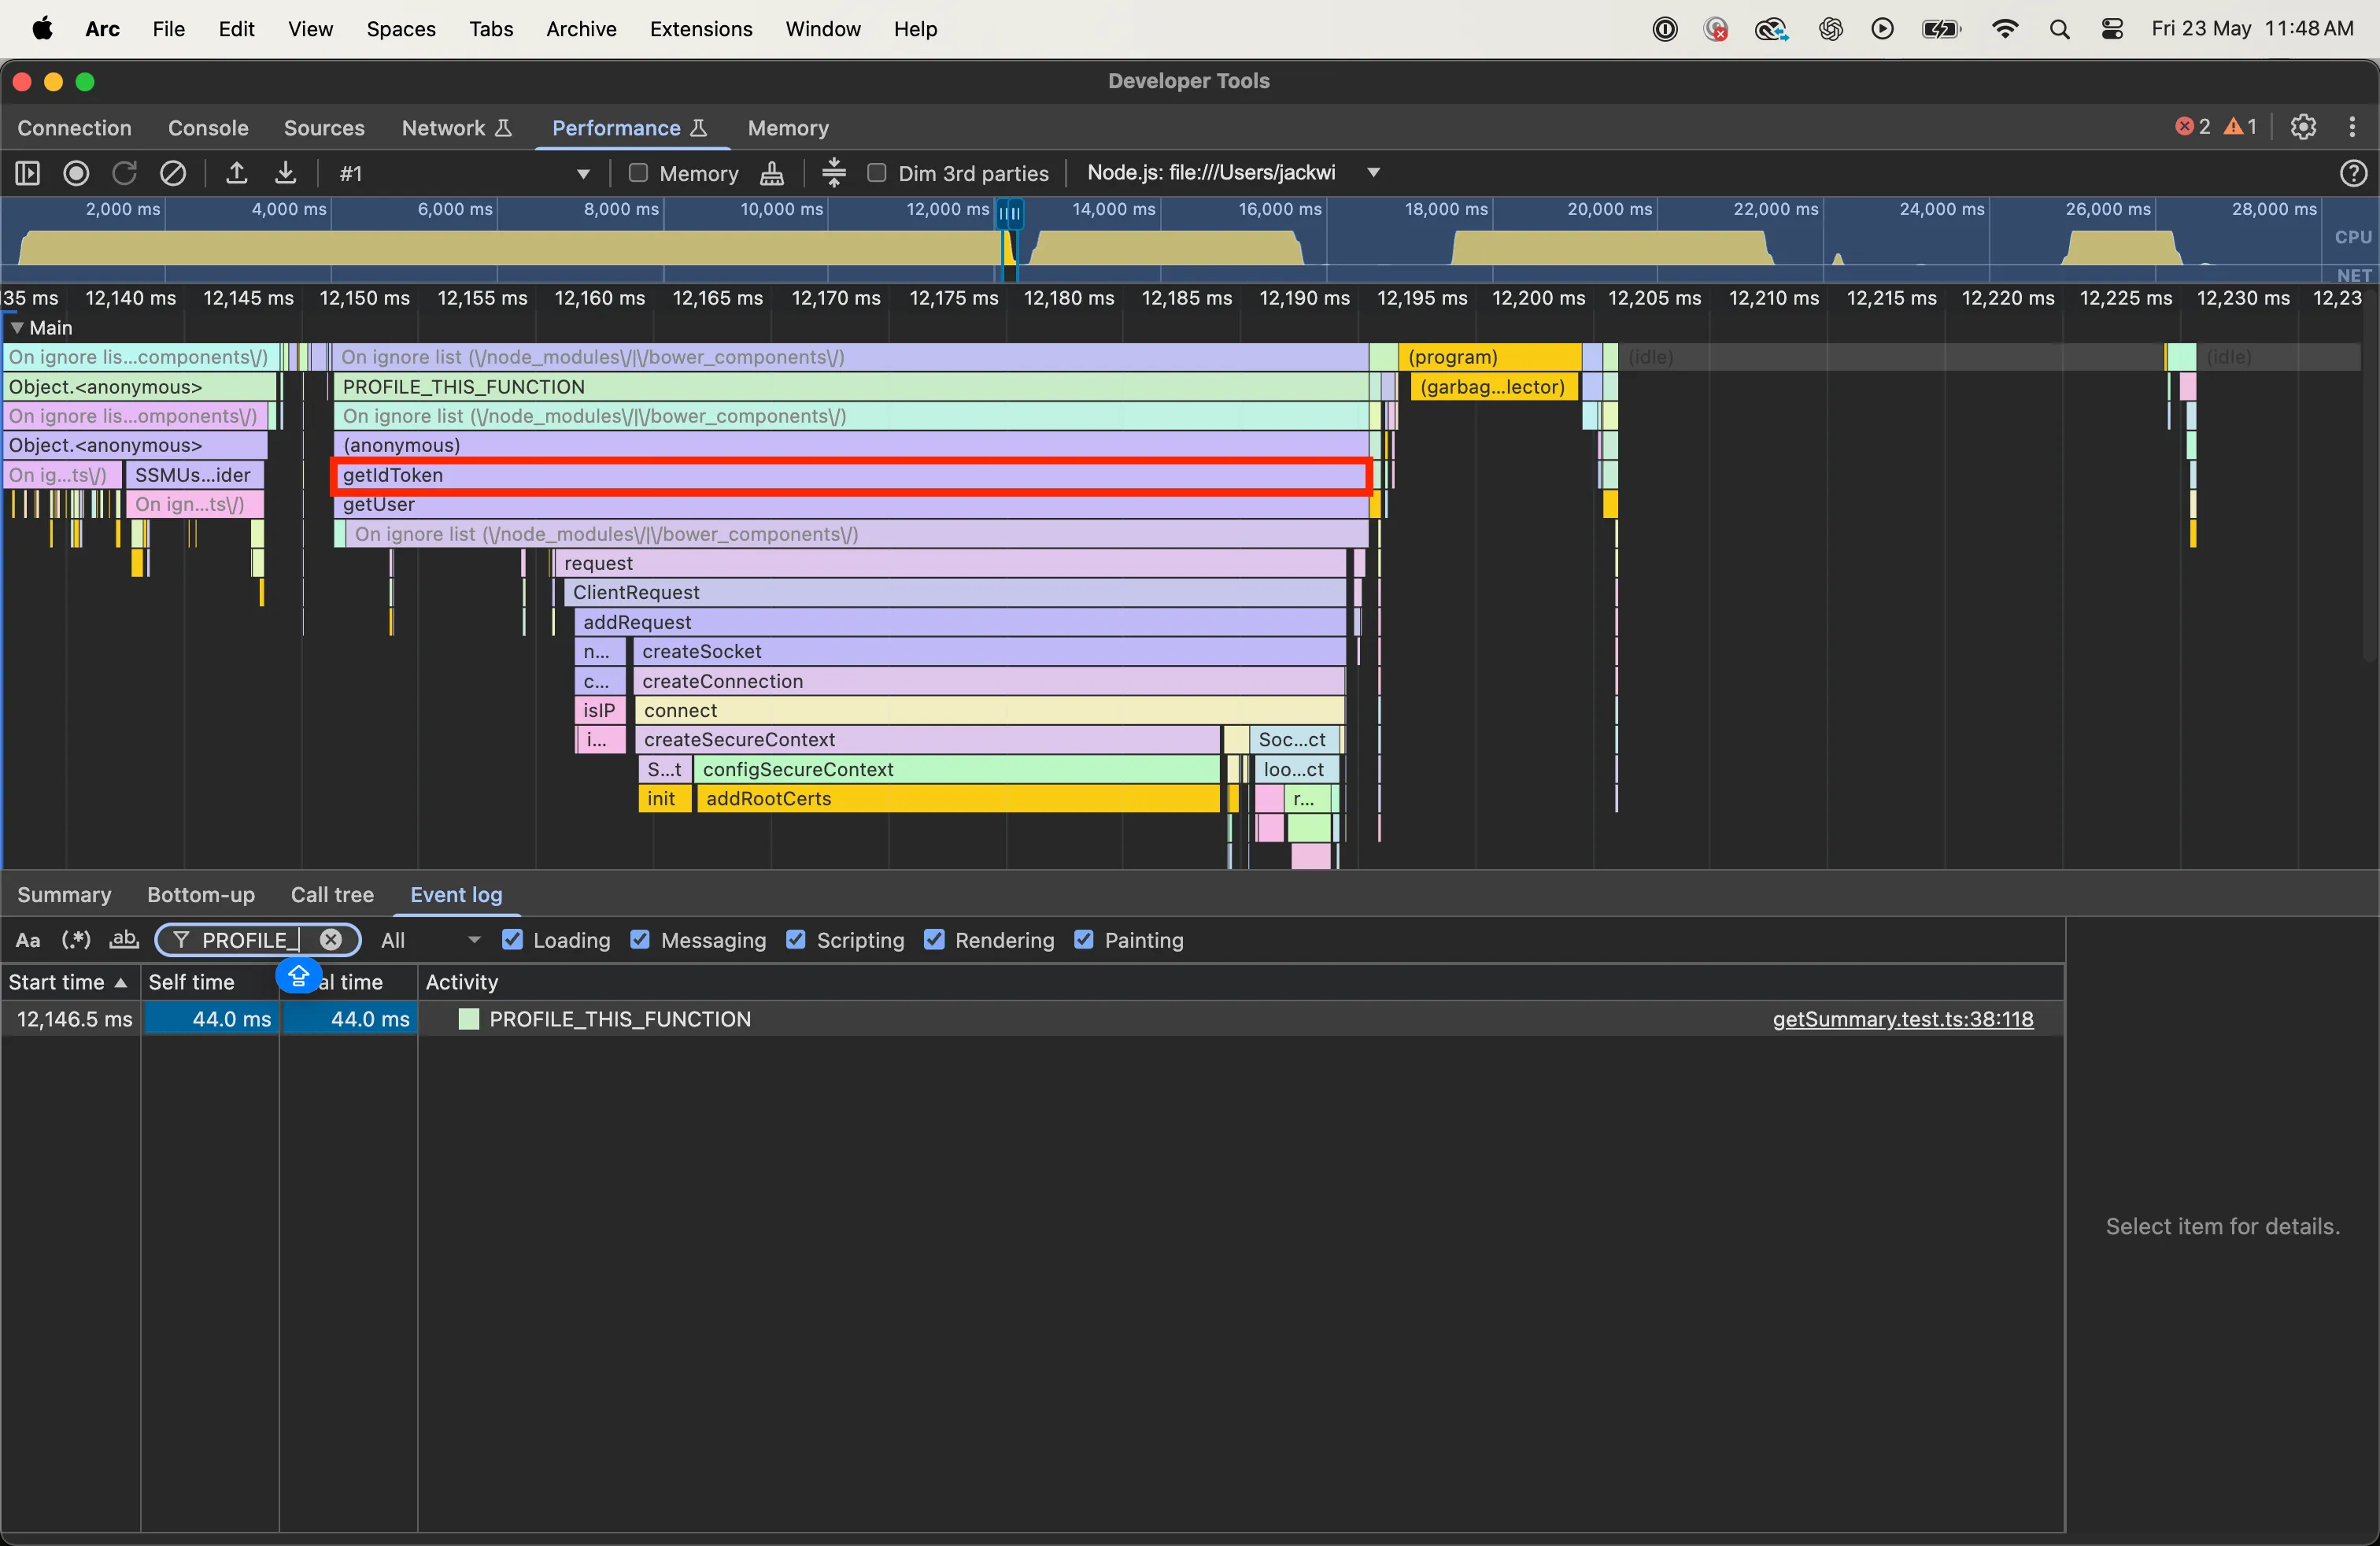
If we zoom out to view the full profile and search for getIdToken, we see it’s called twice — and the second call takes up a significant amount of time on the main thread. But this doesn’t really tell us what the underlying issue is. Why is the getIdToken call taking so long?
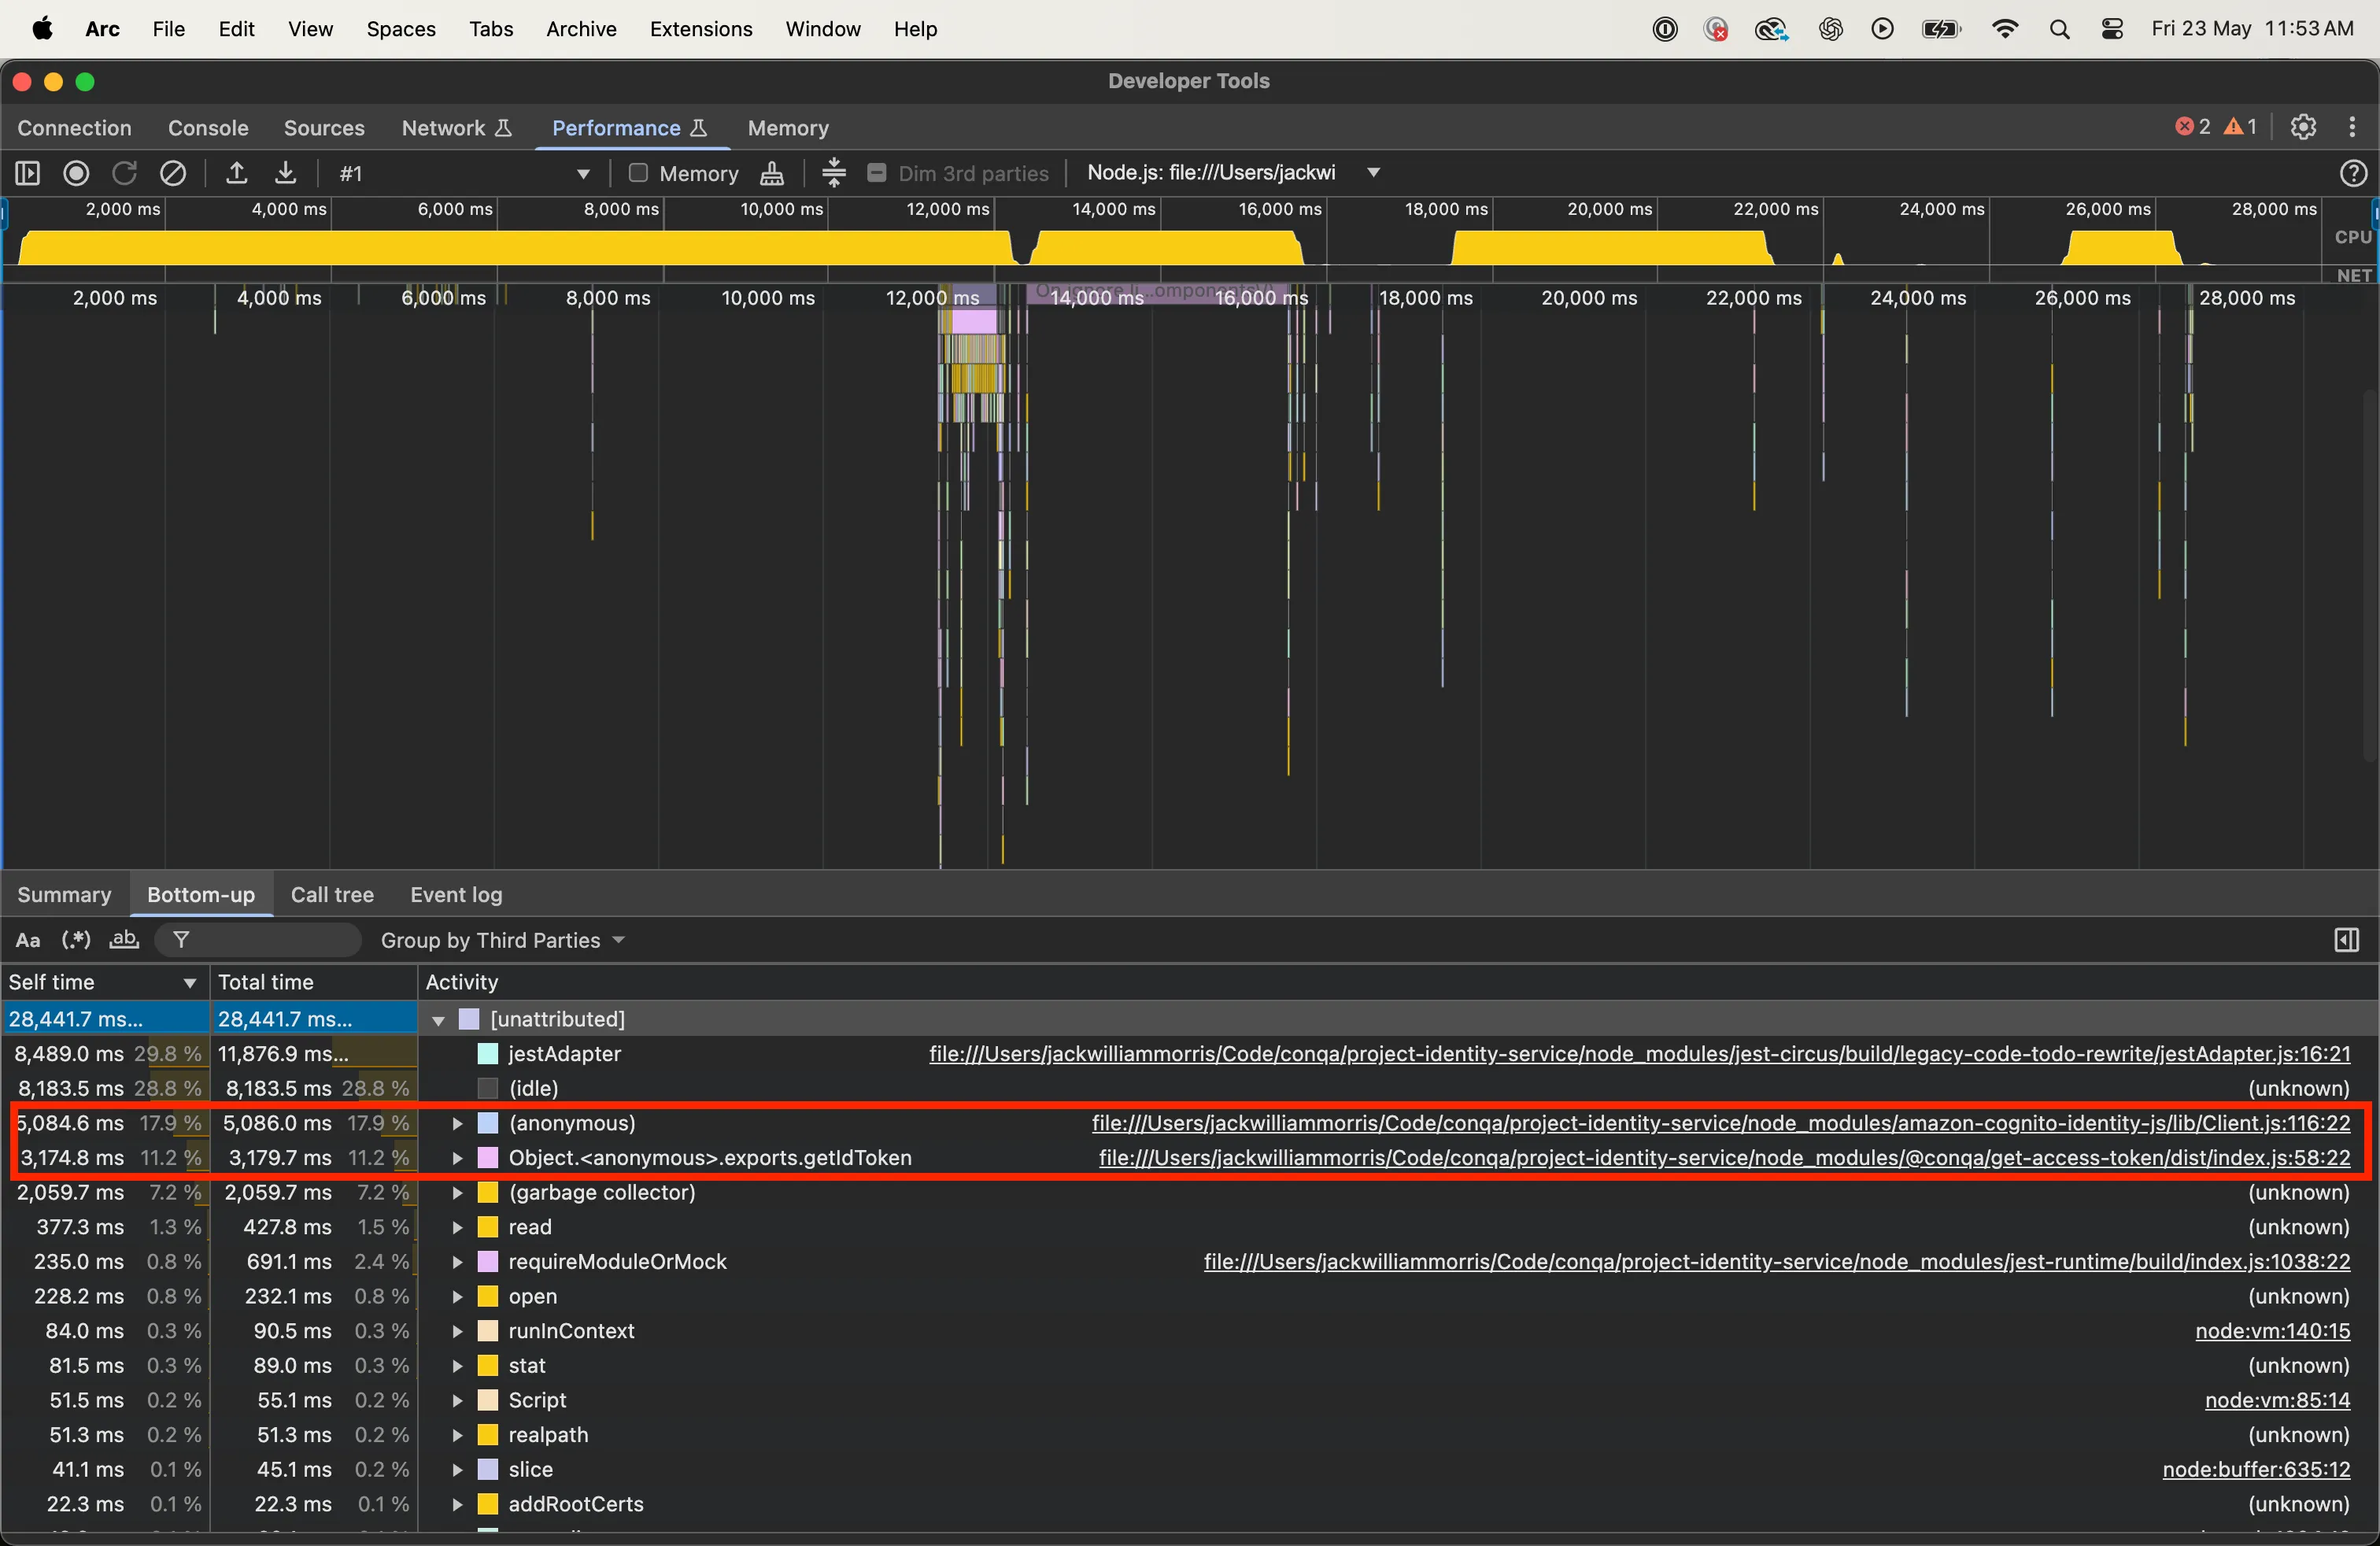
Back in the summary tab, we can see that a large part of the main thread is taken up by @conqa/get-access-token and amazon-cognito-identity-js. The getToken module, which our test imports, uses @conqa/get-access-token, which in turn depends on amazon-cognito-identity-js. Together they take up 29.1% of the total execution time.
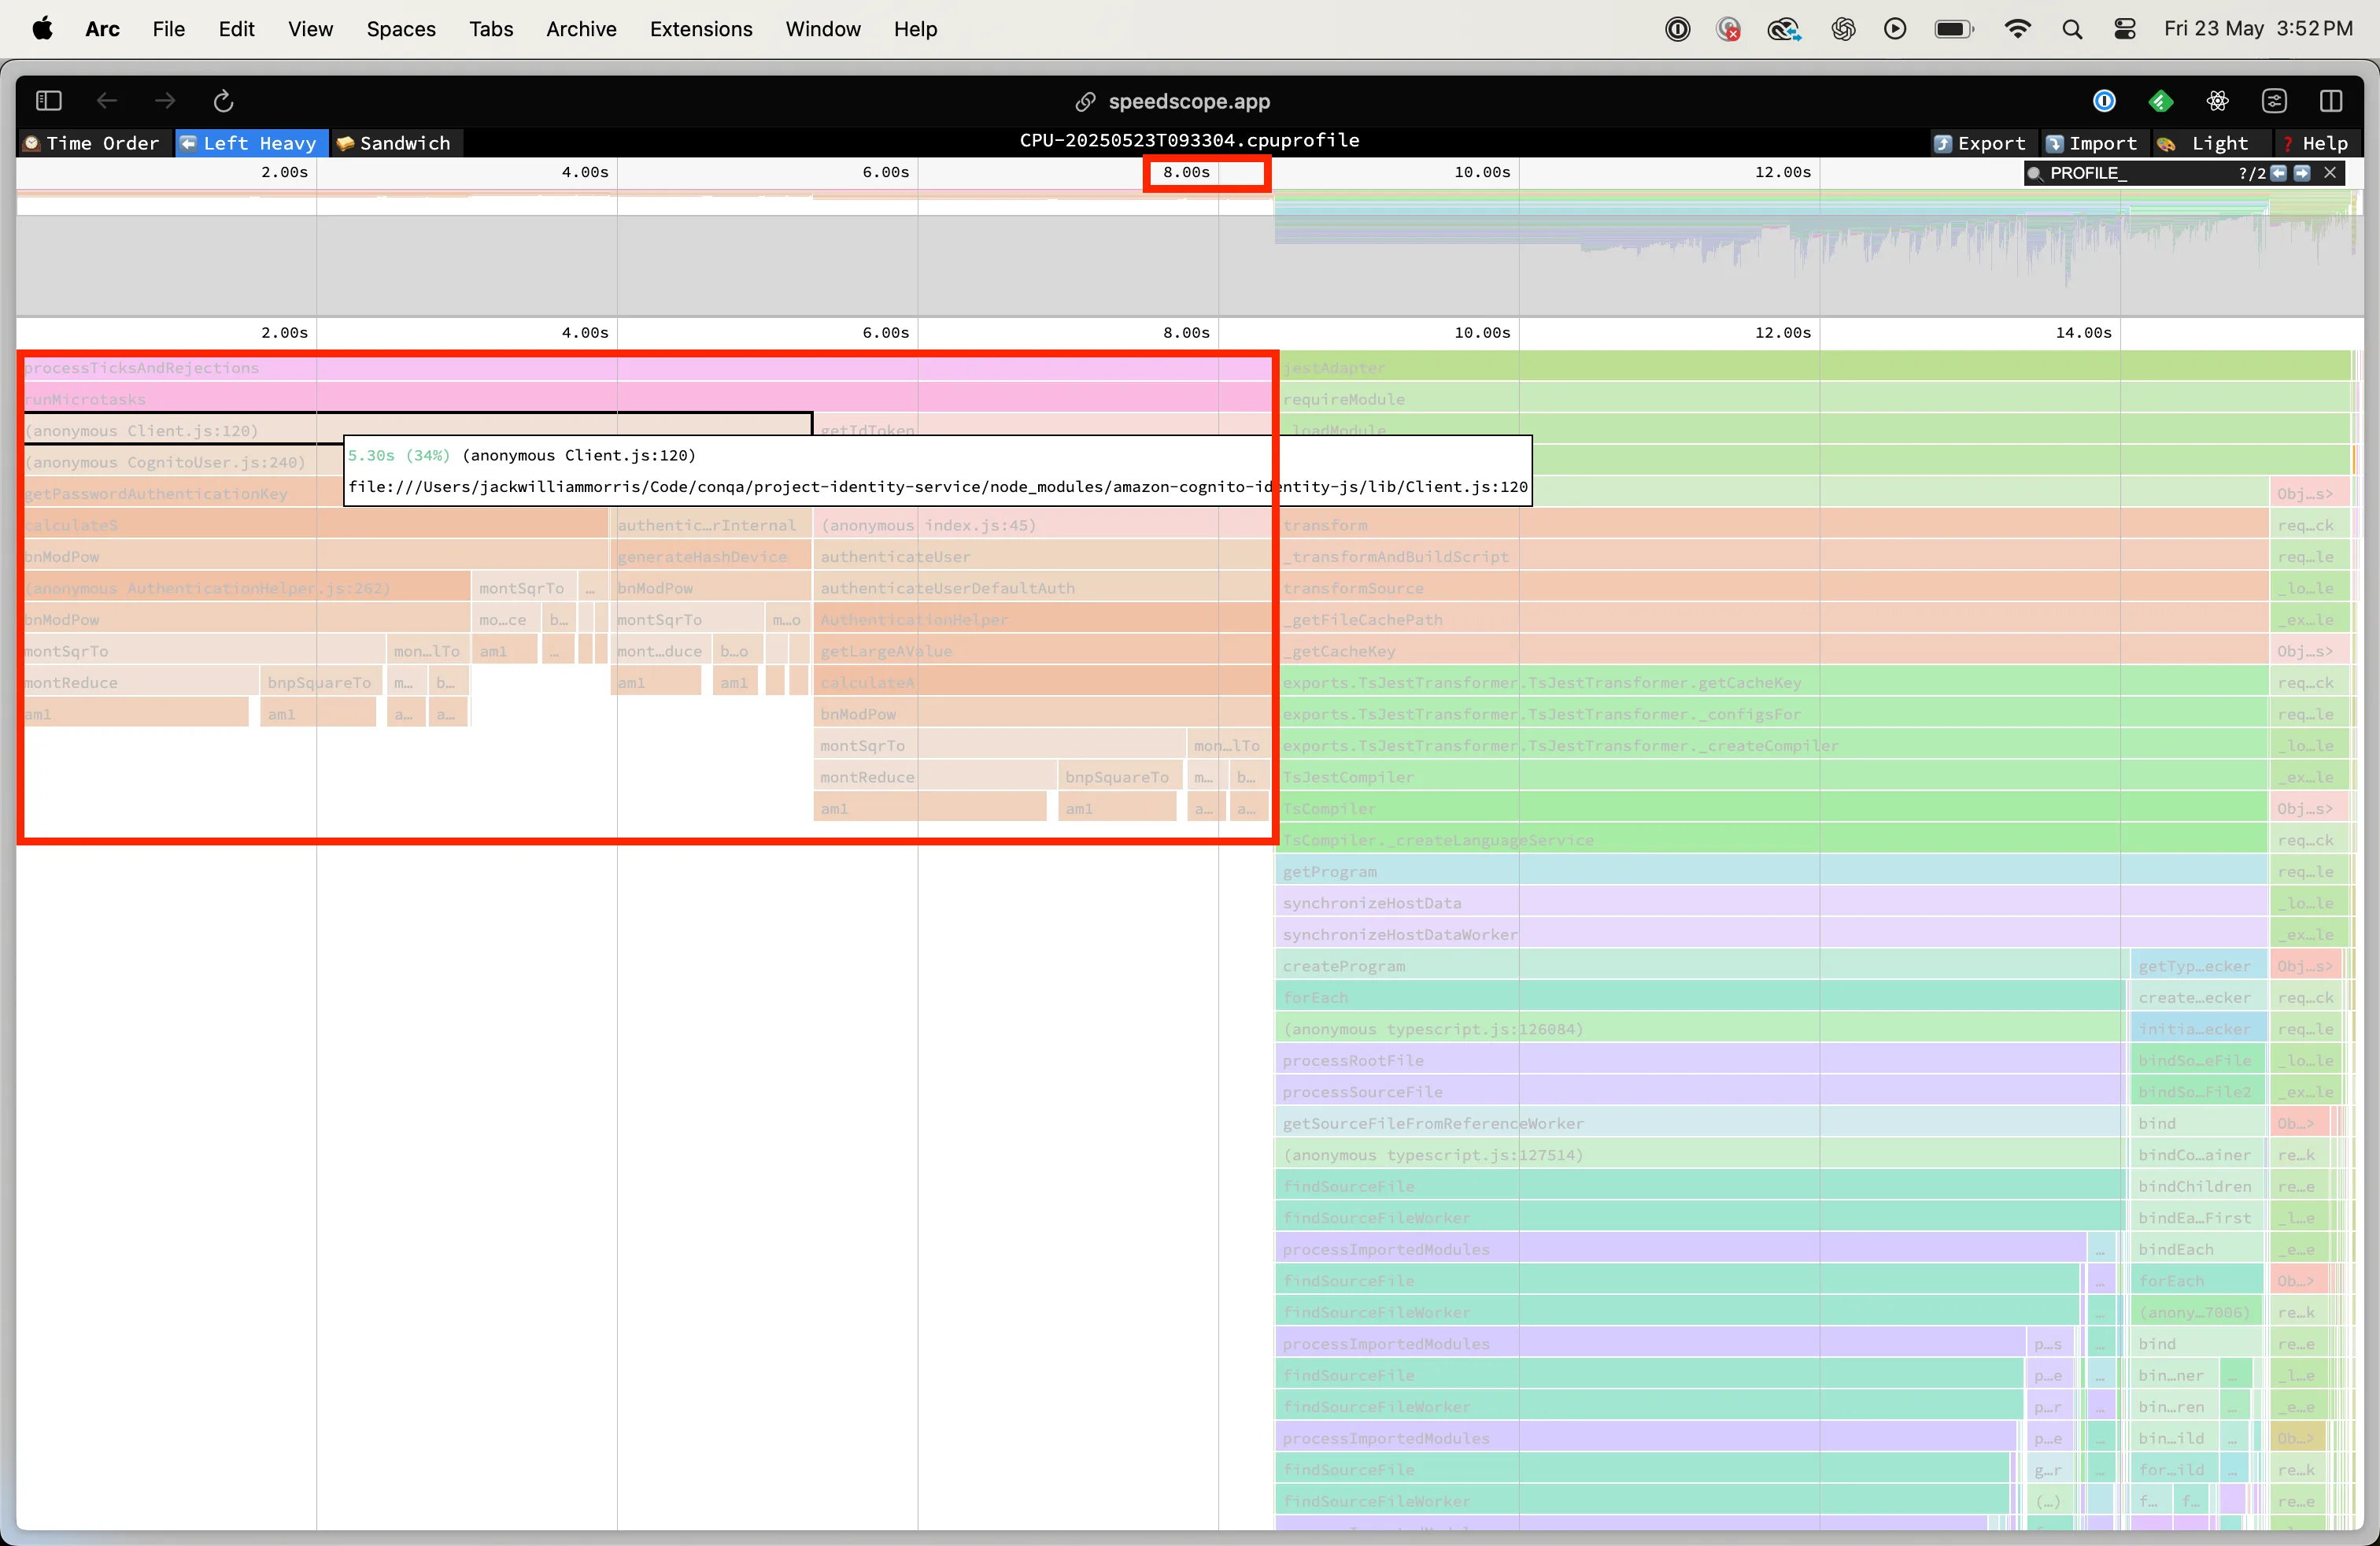
I further confirmed this finding when I uploaded the same .cpuprofile into more insight driven tools speedscope and cpupro.
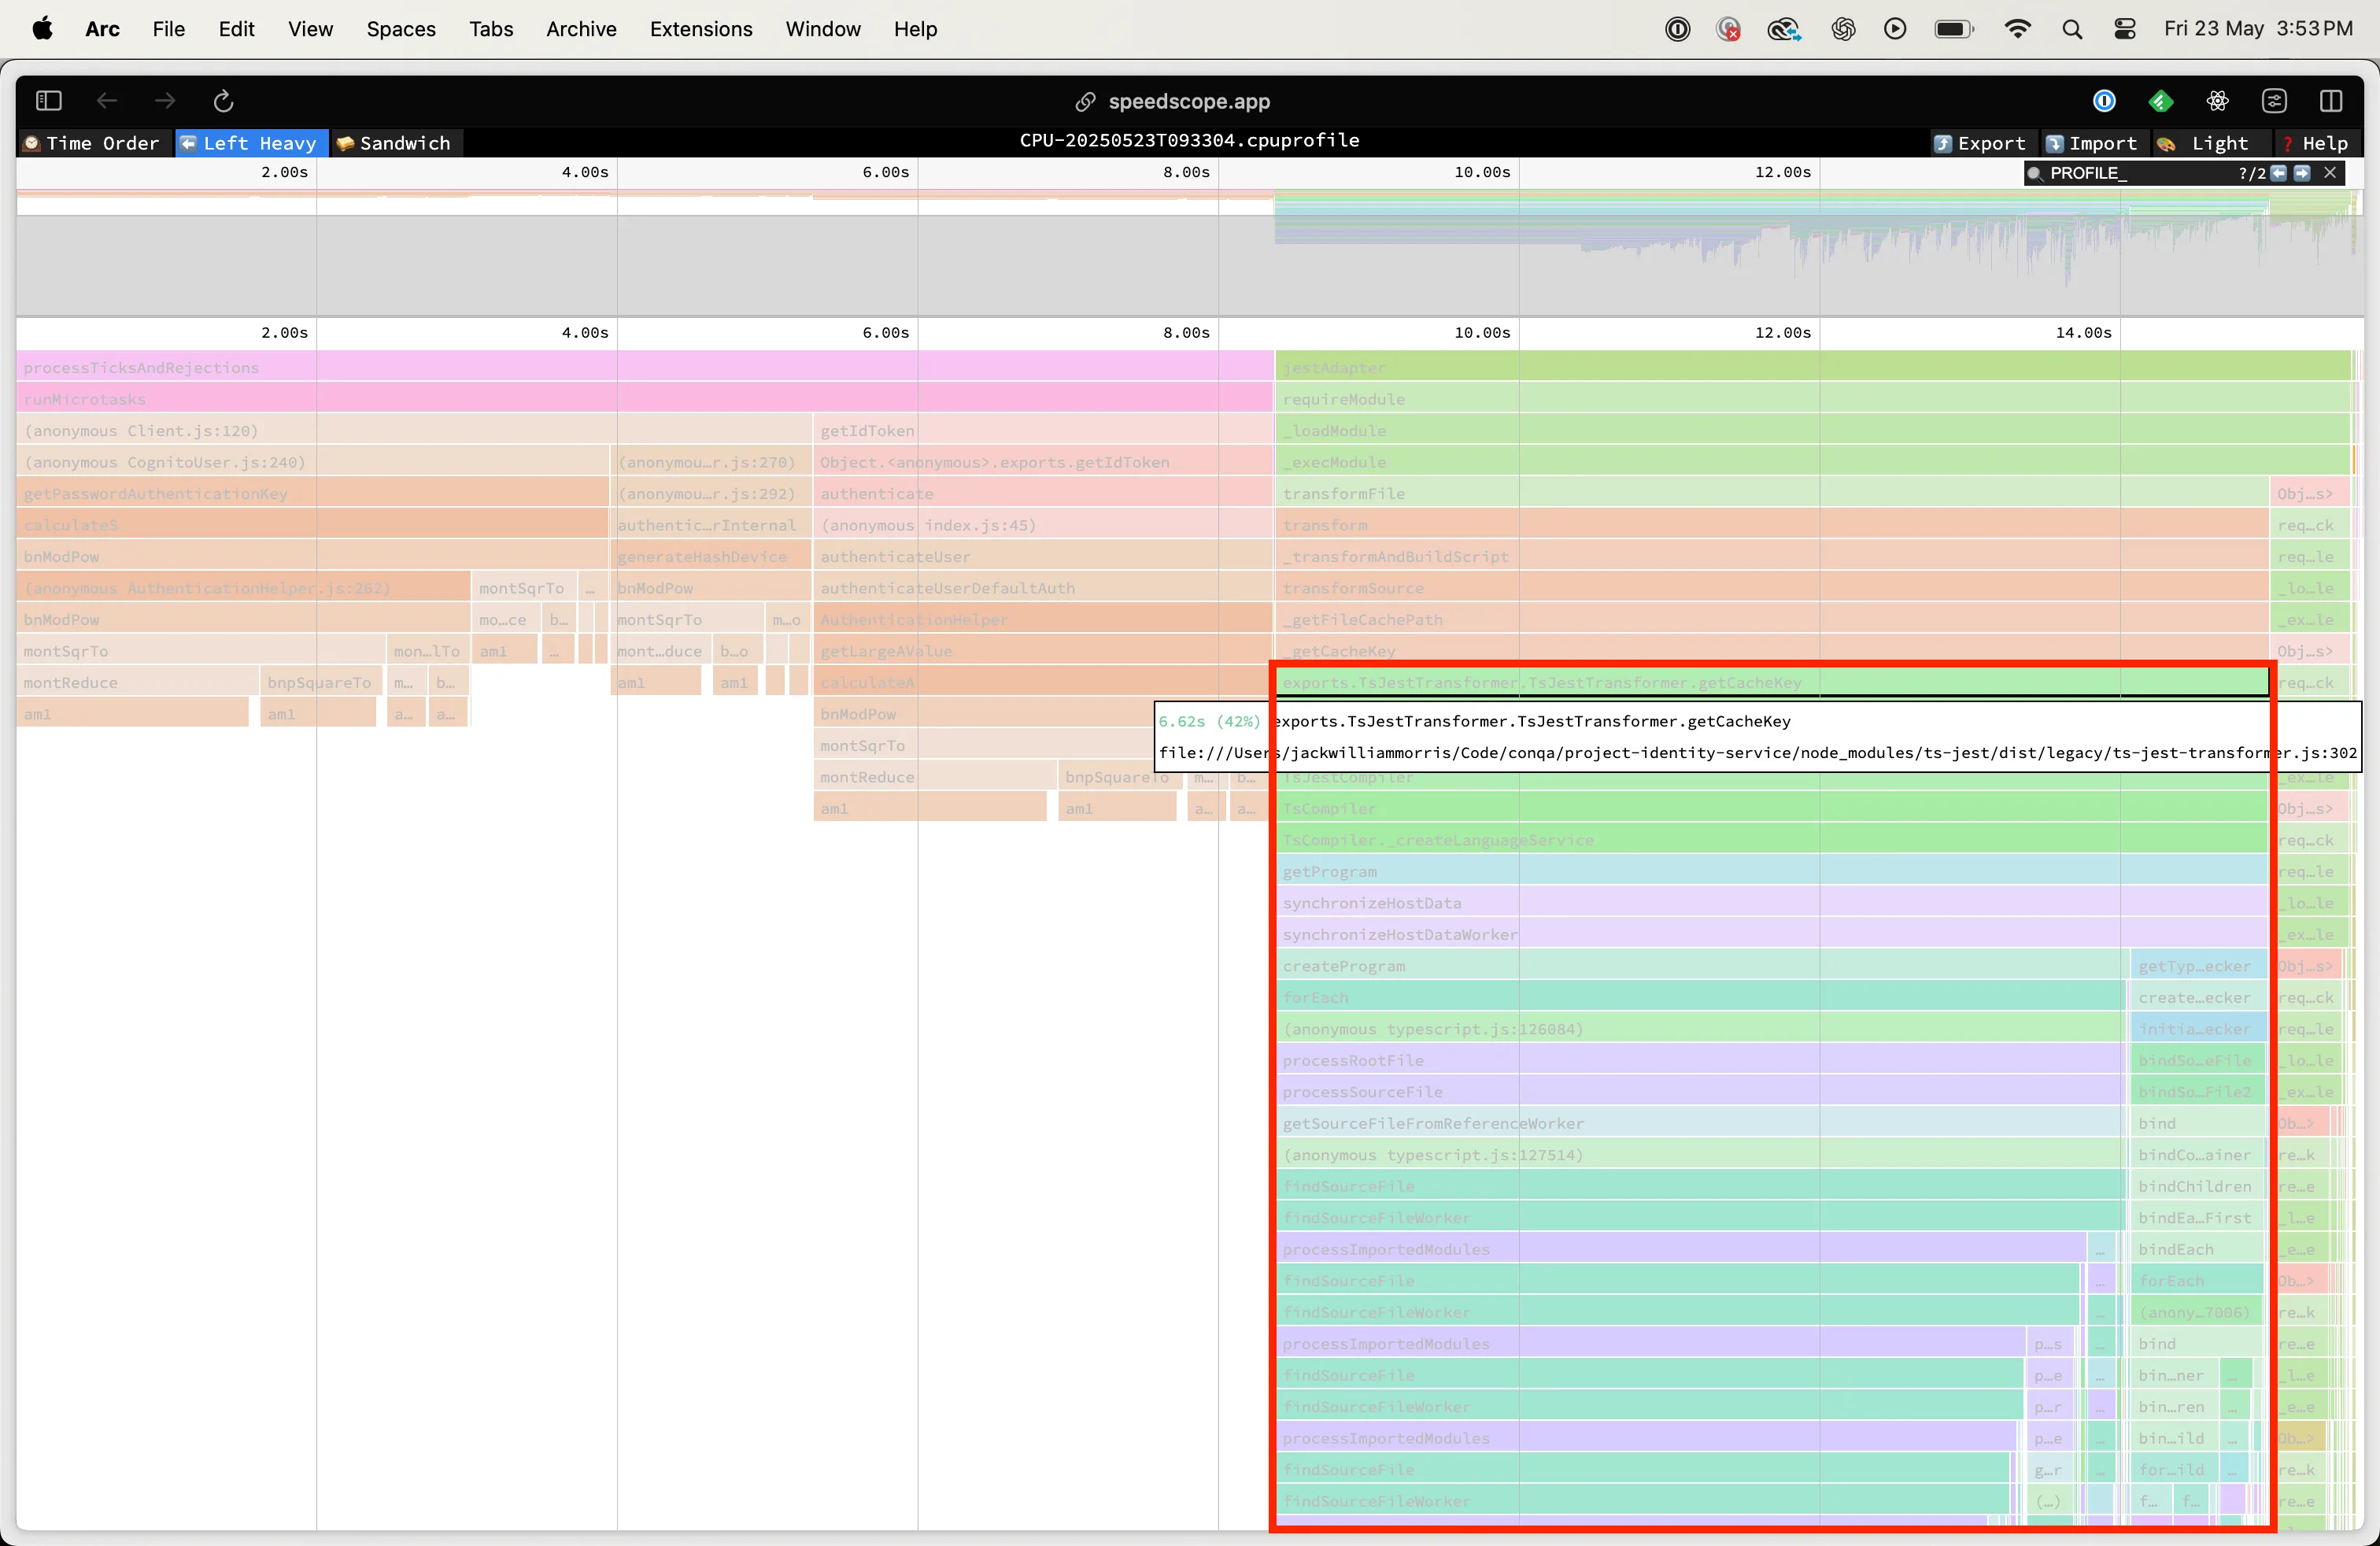
Using the Left Heavy view in speedscope I confirmed that the amazon-cognito-identity-js library was contributing heavily to the overall execution time. The Left Heavy view:
… is useful for understanding where all the time is going in situations where there are hundreds or thousands of function calls interleaved between other call stacks.
I found an even more illustrative picture of this imbalance using cpupro. Bang! Right there! At the top of the list of packages using the most main thread time is amazon-cognito-identity-js.
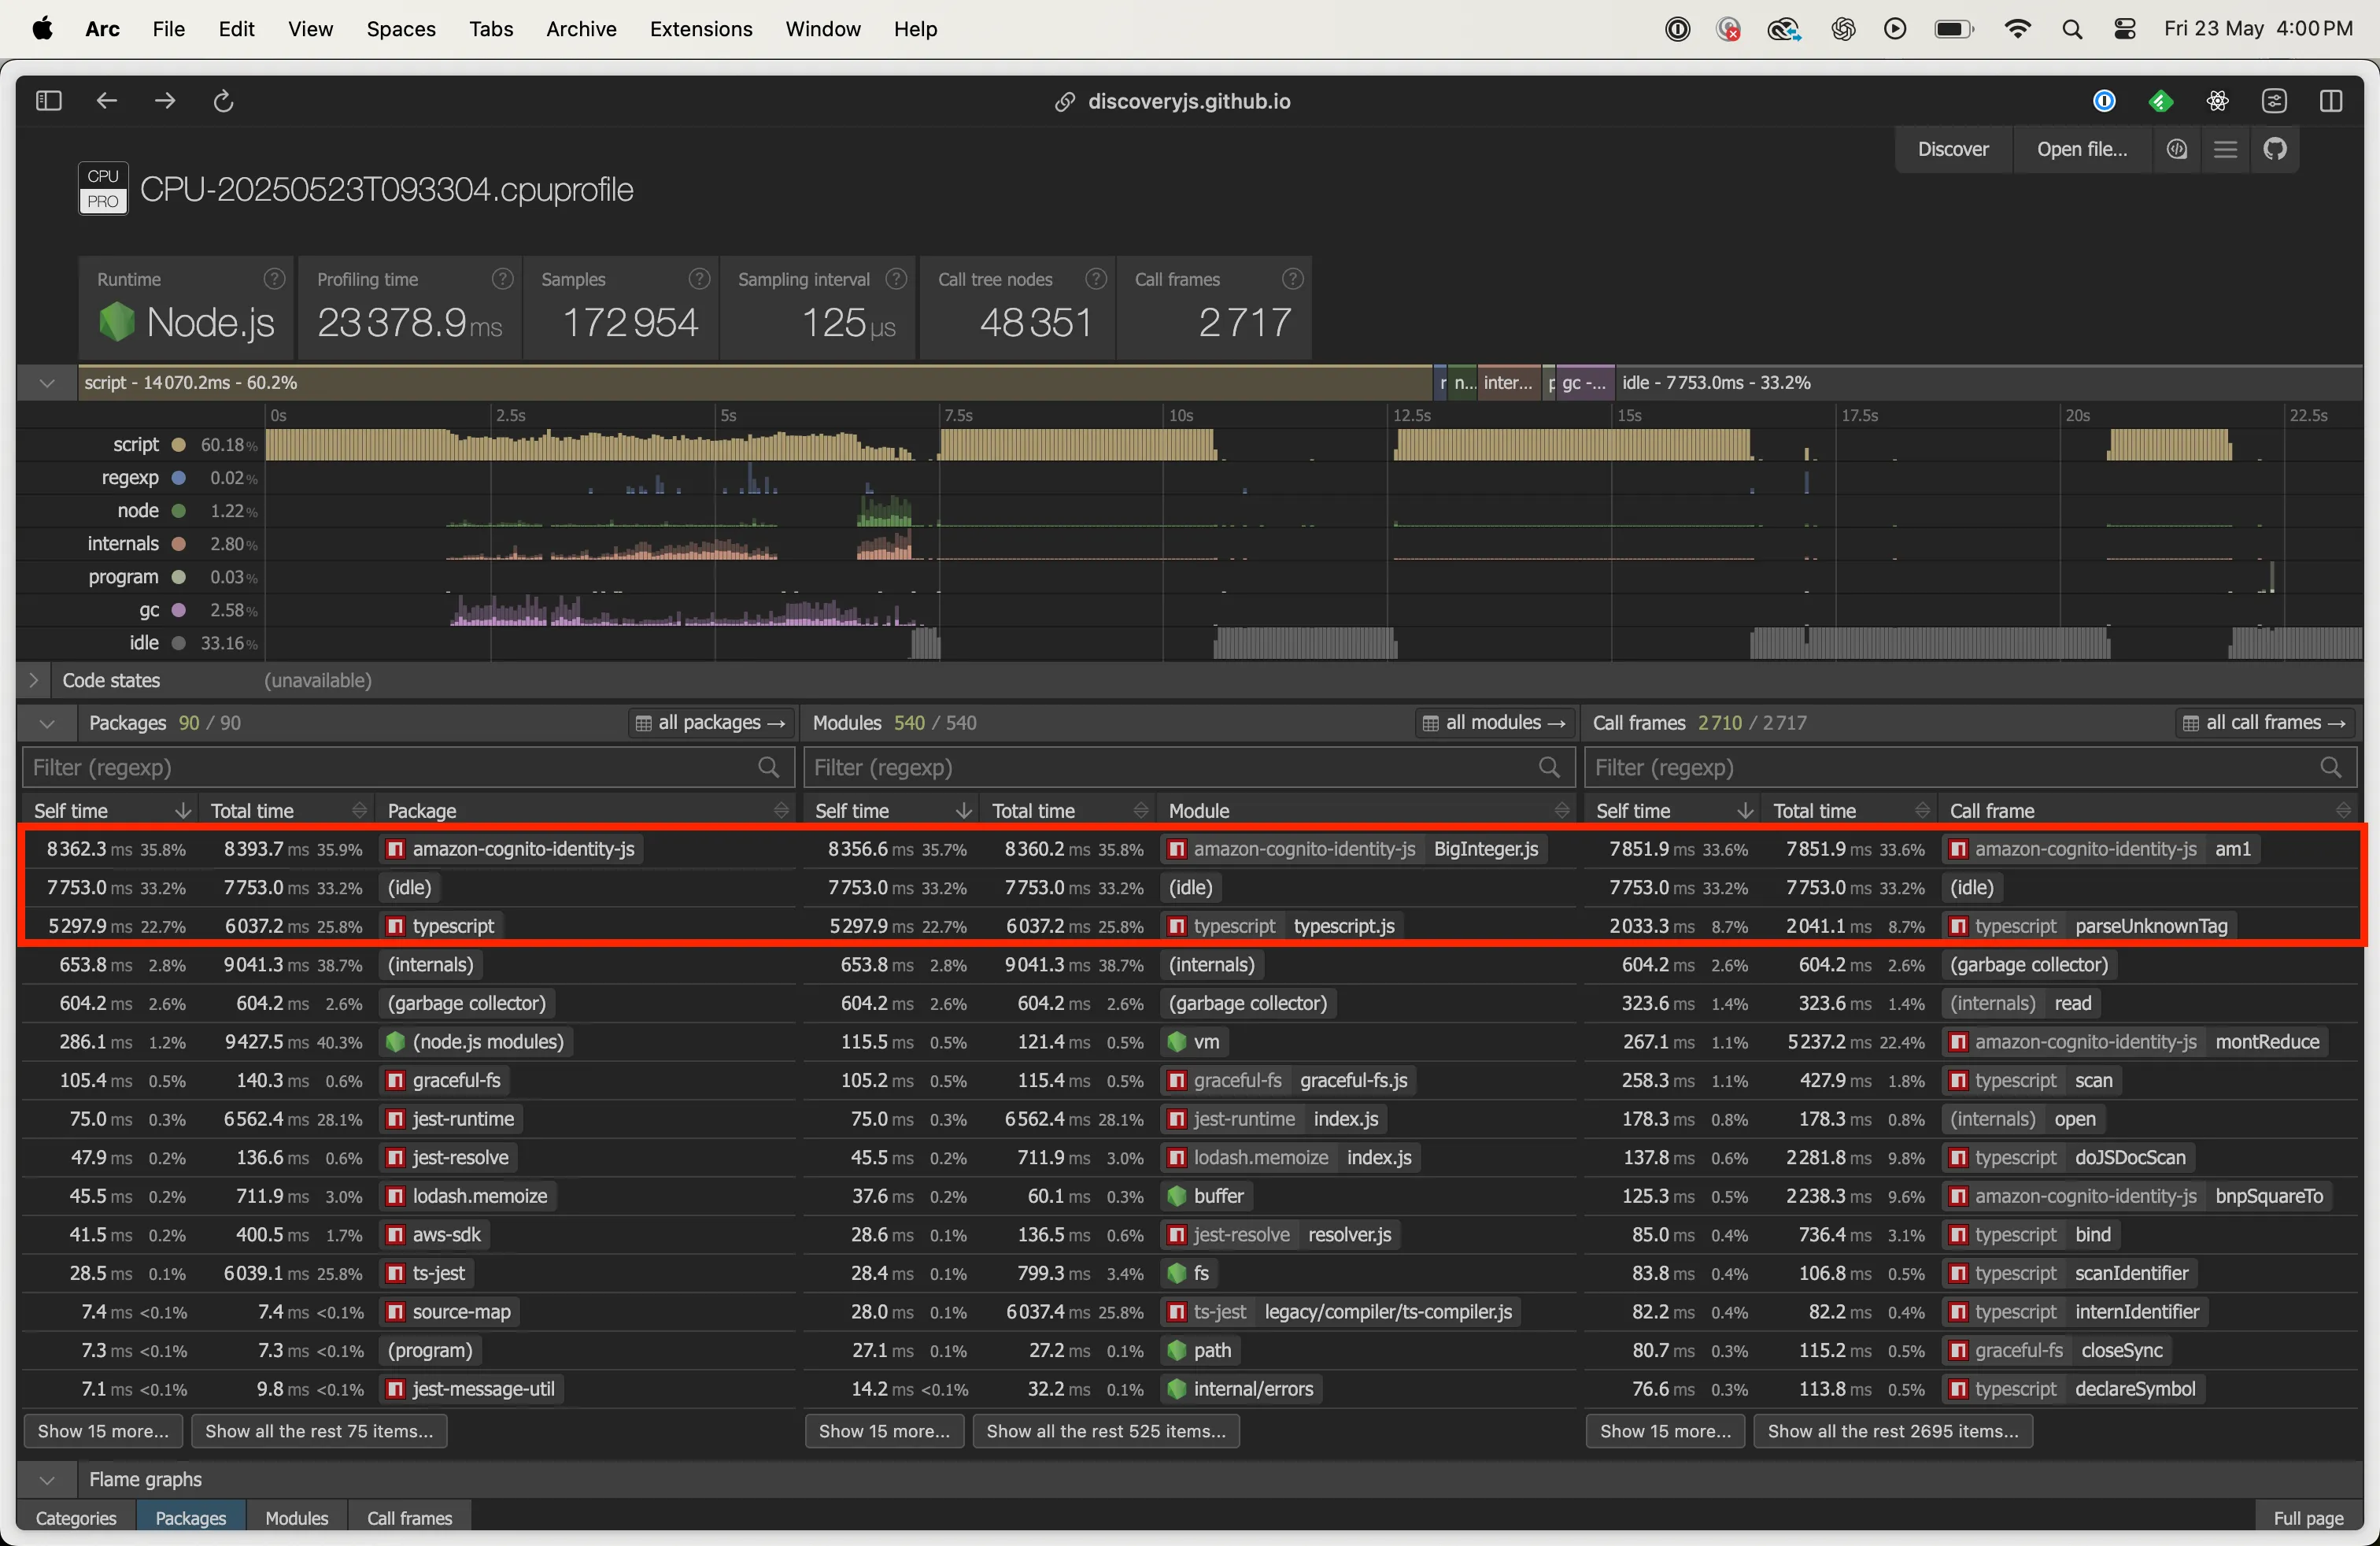
Right below amazon-cognito-identity-js are Jest running idle and TypeScript. This leads us to:
TypeScript
As others have noted, a major reason Jest tests run slowly is because the TypeScript compiler needs to convert the tests into a format Jest can run.
In fact, much of Jest’s idle time happens while TypeScript is compiling. If we start profiling after compilation is done, we see that the main cause of the slow test is the amazon-cognito-identity-js package.
This project uses ts-jest, which by default runs the full TypeScript compiler:
- It checks types.
- It resolves and checks types in imported files.
- It transpiles TypeScript to JavaScript.
Running tests is expensive, especially since Jest uses multiple workers, each with its own cache—causing files to be recompiled unnecessarily. But even with just one test file, we noticed long compile times while idle.
So, how do we fix this? It comes down to setting boundaries on what we ask the TypeScript compiler to do. For testing, we don’t always need full type checking. Instead, we can just transpile the code and skip type checks, which speeds things up—especially when the goal is just to run the code, not verify types. This trade off is something I explore in [[Faster Tests With No Type Checking]].
The Fix
amazon-cognito-identity-js
The fix for this is a little too internal to expose here.
TypeScript
As mentioned, employing the TypeScript compiler in a “do everything” mode might be our problem here. We can limit its responsibilities through setting the right configuration options. I think that is a task better tackled in a separate blog post: Faster Tests With No Type Checking.
Other Possibilities
The post Jest - Tackling Performance Issues was a helpful starting point. It suggested that performance problems could be caused by barrel imports and complex module resolution. But I only had two imports, so that didn’t seem relevant. It also looked into memory leaks, which mostly affect multiple test suites—but I was only running one, so that wasn’t it either.
Another useful article was How I divided by ten the time of execution of my jest unit testing. It blamed slow tests on using real timers and on TypeScript compilation. The author recommended skipping type checking during tests by enabling “isolatedModules”: true in ts-jest, and doing type checks separately in CI or pre-commit.
In my case, I wasn’t using barrel imports, timers, or running multiple test suites But, as noticed, it does seem that TypeScript compilation was a big contributor to slowness.
References
Profiling a Jest Test with Chrome DevTools Helped guide the setup for collecting and analysing performance profiles using Node and Chrome DevTools.
Jest - Tackling Performance Issues Offered useful context around issues like barrel imports, complex module graphs, and memory leaks—though not directly relevant to this case.
How I divided by ten the time of execution of my jest unit testing
Highlighted the impact of real timers and TypeScript compilation. Introduced the idea of skipping type checking with ts-jest and using “isolatedModules”: true.
speedscope
A powerful visualisation tool that helped confirm the disproportionate execution time spent in amazon-cognito-identity-js.
cpupro Offered additional clarity into which packages were consuming the most main thread time during test execution.